Examples
Example Spectral Energy Distributions
|
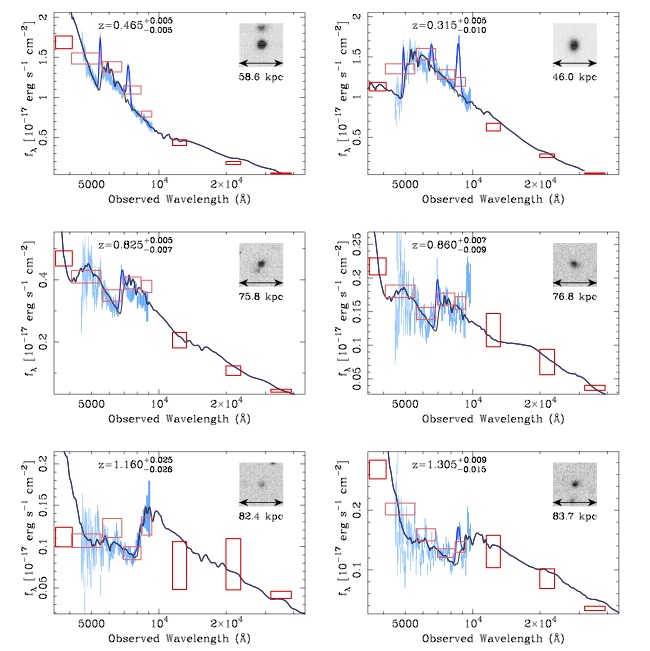
Figure 1: Example SEDs for blue galaxies, along with their CSI redshifts and 95% confidence limits. The IMACS spectra are shown in cyan. The red boxes mark the broadband flux measurements in , noting that the SED fitting was performed using . The best-fit stellar population models are shown with thick black lines. When the data require emission line components in the fit, these are shown using dark blue. Inset we show the CFHTLS z-band images of the galaxies. In particular, we note the top-left and bottom-left, two galaxies for which broadband photometry alone would be insufficient to provide redshift estimates. Low dispersion spectroscopy is key to isolating Balmer breaks and emission lines in blue galaxies, leading to redshift uncertainties with very little dependence on spectral type. |
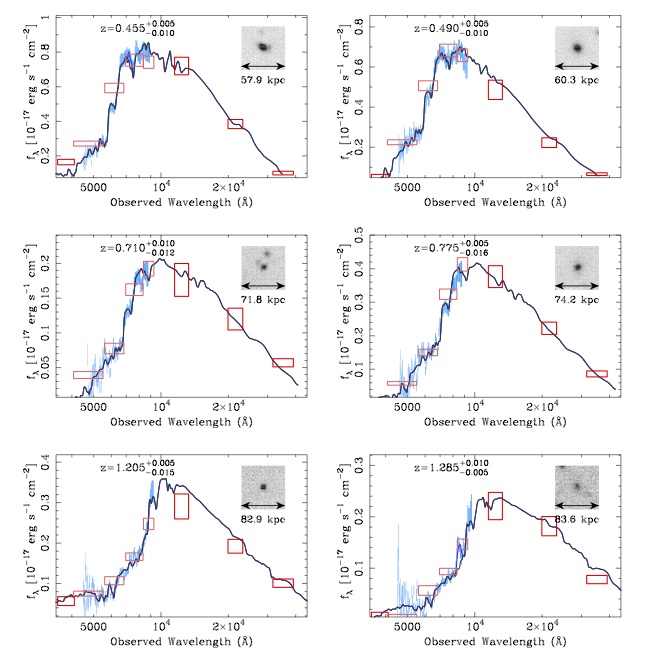
Figure 2: Same as in Fig. 1 but for red galaxies spanning a range of redshifts in CSI. Note the structure in the SEDs traced by both the data and the models outside of the 4000Å break. |


